Live game-show rules · South Island guide
Live game-show wheel probabilities: sectors and multipliers
 Best casinos available in New ZealandUpdated 7 November 2026
A sector probability is only as reliable as the wheel definition and assumptions behind it. For a documented wheel with equally likely segments, divide the number of sectors carrying a label by the total number of sectors. Evolution describes Crazy Time’s main wheel as having 54 segments; a Pennsylvania temporary rule once specified counts for a particular licensed configuration and expired in March 2026. That is a historical worked example, not a verified current distribution or a universal probability for every operator build.
The short answer
For a wheel with a known number of positions, a basic sector chance can be estimated as:
labelled sector count ÷ total equally likely sectors.
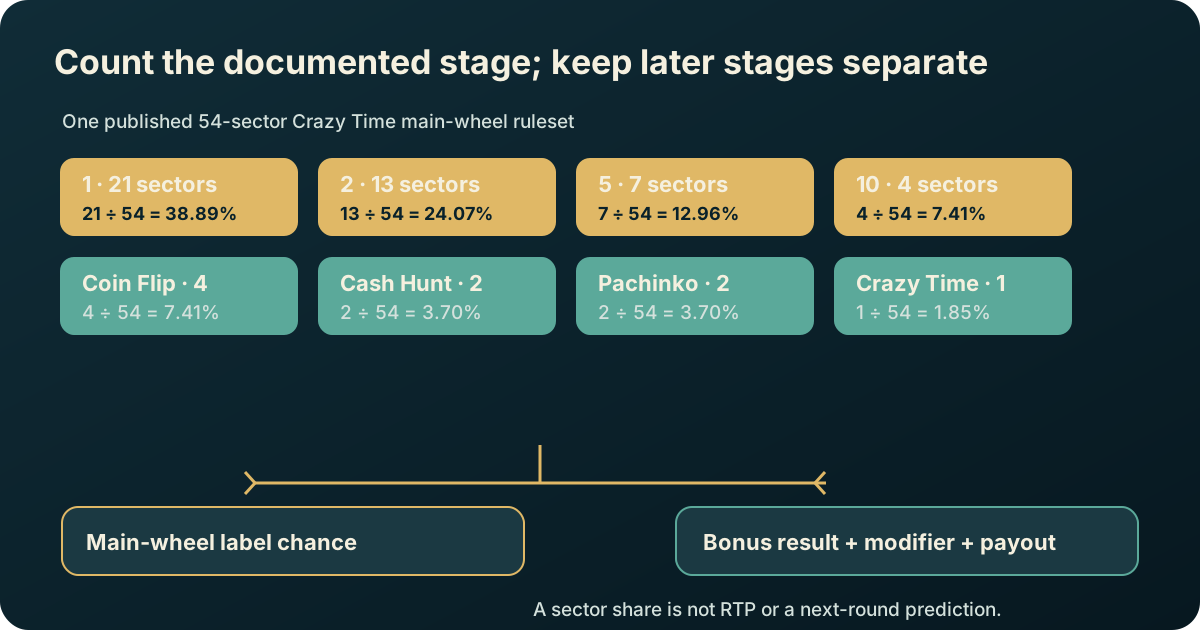
Evolution describes the Crazy Time main wheel as having 54 segments. A Pennsylvania temporary regulation for a jurisdiction-specific licensed configuration listed 21 segments labelled 1, 13 labelled 2, 7 labelled 5, 4 labelled 10, 4 Coin Flip, 2 Cash Hunt, 2 Pachinko and 1 Crazy Time World. That rule took effect in March 2024 and expired on 23 March 2026. Under an equal-segment probability assumption, those historical counts convert to label shares by dividing by 54. For example, the Crazy Time World label occupied 1/54, or about 1.85%, of that particular rule’s segments. The current Evolution product page confirms the 54-segment wheel but does not publish this full count breakdown; this historical example does not verify a current New Zealand operator’s distribution.
That calculation answers only one question: how much of the documented main wheel is assigned to a label under the stated model. It does not give the probability of a particular bonus outcome, a multiplier landing, a profitable bet, or a specific return. Bonus stages have their own rules and outcome processes. A payout can also depend on a separate Top Slot or other modifier. Segment frequency is not RTP.
The counts above are an example tied to one published product configuration. They must not be carried over to Dream Catcher, Funky Time, a physical casino wheel, another game-show product or a future rules version. Before using any number, identify the exact title, the wheel stage, the total count, the source date and any stated randomness assumptions. If a current game help does not disclose the necessary count or payout rule, mark the probability as unknown rather than guessing.
What a sector count does and does not tell you
A sector is a labelled position on the wheel. A sector count is the number of positions that carry a particular label. If there are 54 equally likely stops and 21 show “1”, then the modelled chance of that label is 21 out of 54. The same calculation can be written as a fraction, a decimal or a percentage. Keeping the count visible is helpful because a percentage without its denominator can conceal which ruleset or wheel was used.
The calculation relies on a denominator and a probability model. You need to know that the listed positions are the relevant outcomes, that they refer to the same stage, and how the game chooses a stop. In a physical wheel, equally sized sectors do not by themselves prove that every physical spin is perfectly uniform. In a digital or streamed product, use the game’s own published rules and approved mechanics rather than inferring the outcome model from the wheel’s appearance.
A count also does not determine a payout. If a label occurs in 21 of 54 segments, its probability is approximately 38.89% under the equal-position model. The amount returned after it lands depends on the bet’s published odds, whether the original stake is included in a displayed payout, and whether a separate multiplier applies. The calculation describes a chance of an event, not the value of that event.
It does not predict the next result. A wheel landing on the “1” label several times in a row does not reduce the number of “1” sectors in the next round. A recent-results panel is a record of past outcomes; unless the rules explicitly create a stateful process, it is not a forecast of what must happen next. A streak can occur in a process whose long-run distribution is unchanged.
Nor does the count describe a specific player’s chance of ending ahead. That requires the exact bet, the payout table, all additional selection mechanics and the total amount staked. A participant can win a low-paying outcome and still receive less than the total staked across several bets. Conversely, a rare outcome can pay a larger amount. The event count is only one input into the analysis.
A historical worked example: one Crazy Time configuration
Evolution’s Crazy Time product page describes a main wheel and four separate bonus games: Coin Flip, Cash Hunt, Pachinko and Crazy Time. Its how-to-play page states that the wheel has 54 segments. A Pennsylvania temporary regulation, effective from March 2024 through 23 March 2026, required a particular licensed Crazy Time wheel to use the following distribution. It is a useful historical worked example because the counts add to the stated total. It is not evidence that the same distribution is used by every current table.
| Main-wheel label | Published segment count | Fraction of 54 | Approximate share |
|---|---|---|---|
| 1 | 21 | 21/54 | 38.89% |
| 2 | 13 | 13/54 | 24.07% |
| 5 | 7 | 7/54 | 12.96% |
| 10 | 4 | 4/54 | 7.41% |
| Coin Flip | 4 | 4/54 | 7.41% |
| Cash Hunt | 2 | 2/54 | 3.70% |
| Pachinko | 2 | 2/54 | 3.70% |
| Crazy Time World | 1 | 1/54 | 1.85% |
| Total | 54 | 54/54 | 100% |
For the “1” row, the arithmetic is 21 ÷ 54 = 0.388888…; multiplying by 100 gives 38.888…%, conventionally rounded to 38.89%. For the single Crazy Time segment, 1 ÷ 54 = 0.018518…, or about 1.85%. The unrounded fraction is more precise than the displayed percentage. If someone multiplies the rounded value over many trials, tiny rounding differences can appear.
The table is about a historical main-wheel layout only. It does not say that a 1 bet returns a particular amount, nor does it state the probability of any multiplier in a bonus. The four bonus labels lead to distinct features after the main-wheel result. The bonus stage adds a new question: what outcomes can happen after that feature starts, and with what probabilities? Unless a source supplies the full conditional distribution and payout rules, the answer cannot be derived from the main-wheel counts. Do not cite this table as current unless the exact table’s current help confirms the same layout.
The count sum is a useful consistency check: 21 + 13 + 7 + 4 + 4 + 2 + 2 + 1 = 54. If another source lists values that sum to a different number, check whether it is describing a different version, a different wheel or a transcription error. Do not average the tables or choose whichever version produces a more attractive percentage. Preserve the source title, jurisdiction, effective dates and expiry beside the count.
The product page and how-to-play material are the primary sources for the named game’s broad structure. The detailed segment breakdown used here comes from the official Pennsylvania Code’s temporary rule for a jurisdiction-specific licensed configuration, not from a current New Zealand game-help panel. The Code itself records the rule’s expiry date. That distinction makes the example traceable while signalling that the current in-game help should be checked before applying any count to an account-specific version.
Read the game in stages, not as one probability
A game-show wheel can contain several outcome stages. The main wheel first selects a number or a bonus label. A bonus label can launch a mini-game with its own outcomes. A separate Top Slot or multiplier mechanism may then alter a prize or select which bet spot receives a multiplier. These are not simply additional sectors on the first wheel. Each stage has its own rules and denominator.
For a multi-stage event, ask whether the probabilities are unconditional or conditional. “The main wheel lands on Cash Hunt” is an event on the 54-position wheel. “A chosen Cash Hunt symbol reveals a multiplier of a particular size” is an event inside the Cash Hunt feature. The second probability is conditional on entering that bonus and on any subsequent selection process. Multiplying these values is valid only when they refer to the right events and the model states how the stages connect.
Suppose a rules source says a bonus label occupies 2 of 54 positions and separately says an outcome has a 1-in-10 chance once that bonus starts. If the two stages are independent under the product rules, a simple joint probability would be (2/54) × (1/10). But independence must be documented or be a justified part of the exact model. If the first result changes the second-stage distribution, a direct multiplication would be wrong. This is an illustration of conditional reasoning, not a probability claim about any specific bonus.
A multiplier may also apply to a payout rather than change the probability that the main wheel reaches a label. These are different mechanisms. If a modifier is selected separately, the model must establish which bet it modifies, the possible values, whether the choice is random, and whether the multiplier changes gross payout or net profit. Without those rules, adding the multiplier to the sector denominator makes no sense.
Use a simple tree when documenting stages: main-wheel label; bonus entry or direct settlement; bonus outcome; multiplier selection if present; final payout under the table. Put the relevant source beside each branch. A reader can then see which claim is established and which remains unknown. This approach prevents a headline probability from being presented as the chance of “winning the bonus” when it only describes a main-wheel trigger.
Probability is not payout, expected return or RTP
Probability is the chance of an event under a model. Payout is the amount returned when a defined bet wins. Expected return combines outcome chances with their corresponding gross returns. RTP is a theoretical long-run return measure for a complete game and configuration. These terms are related but cannot be substituted for one another.
For a simple mutually exclusive set of outcomes, expected gross return per unit staked can be written as the sum of each outcome probability multiplied by the gross return for that outcome. If an outcome pays nothing, its gross return is zero. If a posted “2 to 1” is net winnings and the original stake is returned, the gross return for a winning unit may be three units; if the help defines payout differently, use its definition. The expected net result then subtracts the total stake from expected gross return.
This small formula depends on an exact table. For Crazy Time, the main-wheel label count is only one input for number bets. Bonus bets involve a feature outcome, a payout or multiplier, and possibly a separate Top Slot result. A complete calculation needs the probability and value of every possible settlement, including whether a losing or winning bonus result is transformed by another stage. A secondary page giving only “bonus frequency” cannot establish a full RTP.
An illustrative example can show the difference without pretending to model a real product. Imagine a hypothetical wheel with four equally likely stops: A, B, C and D. If A returns two units gross on a one-unit stake, B returns three, and C and D return zero, the expected gross return is (1/4×2)+(1/4×3)+(1/4×0)+(1/4×0)=1.25 units. The theoretical net is 0.25 units per stake in that hypothetical example. No live product is being described; the example only shows why outcome values must accompany probabilities.
For a specific published game, do not convert a short run into RTP. A player could see a very different sequence from the theoretical model. RTP does not mean that a person receives a fixed percentage of their deposits back, that the next set of rounds will converge to the figure, or that a high multiplier makes an underlying wager favourable. A long-run theoretical value is not a session guarantee.
How to verify a count before using it
Start with the exact product title and the stage you are analysing. A wheel page may include a main wheel, a bonus wheel, a side wheel or a secondary multiplier selector. Record the title as shown in the game help, not only as shortened in a search snippet. If the provider has several similar game-show products, keep their names and rules separate.
Find the source that states the total number of positions and the count for each label. A provider rulebook, official how-to-play page or regulator-approved game description is stronger than an affiliate summary. A regulator’s technical or game-specific rule can be authoritative for the licensed configuration in that jurisdiction, but it may not prove that every operator offers identical terms. An operator-hosted PDF can be a copy of provider rules; record both the document owner and the host.
Check the date and version. A game can change presentation, payout terms, bonus rules or regional configuration without changing its familiar name. If a document has no revision date, mark that limitation. Compare the list of counts with the claimed total. Counts that fail to sum to the total mean that a category may be missing or a value was copied incorrectly.
Confirm whether every listed stop is treated as equally likely. Equal-sized wedges on screen are a visual property. The published probability model may rely on certified random selection, mechanical weighting, a digital random number generator or another procedure. The article should state the assumption behind the fraction. If the source only shows a rendered wheel and gives no probability method, call the result a count share, not a verified probability.
Finally, read the payout section separately. Identify net odds, gross return, stake return, bonus multipliers, tie or void conditions and any cap. If the paytable uses ambiguous wording, quote it carefully and direct readers to the active help instead of choosing a convenient interpretation. The aim is to make each figure auditable, not to create false precision.
Why different guides may show different numbers
Published guides can disagree because they cover different editions, regional versions, source documents or definitions. One author may count main-wheel segments; another may discuss the number of bet spots; a third may calculate a bonus probability from its own payout model. Those values can all be numerical while answering different questions.
Some pages list a game’s 54 main-wheel stops but then describe each bonus as though its occurrence probability were also 1/54. That is only true for a label occupying one segment, not for a bonus occupying several. Other summaries round 1/54 to 2%, then repeat the rounded figure as if exact. Keep fractions until the final presentation and state the denominator.
A further source of disagreement is confusion between frequency and return. A bonus can trigger less often but pay differently; a frequent low-return event can have a similar contribution to theoretical return as a rarer high payout. A multiplier can alter the amount paid after an outcome without changing the event’s chance of appearing. Statements such as “this bet has the highest chance” do not establish which bet has the best expected value.
Search results can merge similar branded products or use a cached version of a product page. Open each source and confirm the game title and the relevant table. If its page only repeats another review, it is not independent corroboration. Keep a note of source disagreement rather than hiding it by selecting a single convenient number.
This guide therefore uses the count table as an example with an explicit source boundary. It does not claim that the same distribution applies to every operator lobby, that all later game updates preserve it, or that any bet is profitable. The current game help for the exact game being played remains the practical reference.
A worked calculation without a betting recommendation
Take the 21 “1” segments in the 54-segment Crazy Time configuration above. The fraction is 21/54, which can be reduced to 7/18. As a percentage, 7 ÷ 18 × 100 equals 38.888…%. Rounded to two decimal places, it is 38.89%. The 13 “2” segments give 13/54, or about 24.07%. The 4 Coin Flip segments give 4/54, which reduces to 2/27 and is about 7.41%.
These figures are not a ranking of bets by value. To estimate a theoretical return for one label, you would need the gross settlement for a direct hit, the treatment of any multiplier, and whether other events can modify or void the result. To compare two wagers, you would calculate the full distribution for each and use the same stake basis. To describe risk or variance, you would need more than the average return; the range and frequency of outcomes matter too.
Do not infer “once every N rounds” as a schedule. The reciprocal of a probability can describe an average waiting time under a stable independent model, but it is not a promise about the next occurrence. If one event has probability 1/54, that does not mean it must appear on the 54th spin or once in each block of 54. The outcomes can arrive close together or be separated by a longer gap.
If a history panel shows that a label has not appeared recently, the count remains the same for each new round under the assumed model. A past gap does not make the wheel “owe” an event. Conversely, a recent run does not mean that the label has become more likely simply because it appeared repeatedly. Any claim that the process is stateful needs direct evidence in the product’s rules.
For an editor, a clear worked example needs the count table, the source, the formula, the rounding convention and a sentence saying what the result excludes. That is more valuable than a list of uncontextualised percentages. For a player, the same discipline helps avoid treating a theoretical frequency as a tip or an expected payout.
A reusable wheel-analysis worksheet
When evaluating a different money wheel, fill in these fields before publishing any calculation:
| Field | Record | Why it matters |
|---|---|---|
| Exact product and version | Full title and any visible build/rules date | Prevents rules from another show being reused |
| Wheel stage | Main wheel, bonus wheel or secondary selector | Each stage can have its own outcomes |
| Total positions | The documented denominator | Required for a count fraction |
| Label counts | Number of positions assigned to each result | Makes the numerator auditable |
| Selection model | Equal chance, weighted chance or not stated | Determines whether count share is probability |
| Payout definition | Net odds or gross return, including stake treatment | Needed for expected return |
| Modifier | Top Slot, multiplier or feature effect | Can change payout but may be separate from the wheel |
| Cap and currency | Exact published basis | Prevents comparing unlike payout limits |
| Source and access date | Link, owner and date checked | Helps detect stale or mirrored documents |
If the source does not provide a field, use “not published in the reviewed material” rather than an estimate. If the count table is in a regulator document for a specific market, say so. If an operator’s current game help differs from the public provider page, the account-specific help should be recorded and the discrepancy explained.
What this page does not cover
This is a cross-game probability method guide, not a complete rules review of Crazy Time, Funky Time or any other branded show. A product-specific review explains how that title opens a round, which selections are offered, how its bonus features resolve and how its payouts are settled. The sector example here only demonstrates how a documented count can be converted into a fraction.
It also does not compare casinos or claim that any game is available to a New Zealand account. Supplier catalogues describe products; operators determine their own game lobbies, eligibility and terms. The site’s existing Crazy Time rules guide and Funky Time guide discuss those named games separately. Their game rules should not be replaced by this general method page.
Nor does this page provide a strategy, staking pattern or prediction. A percentage is not a recommendation to bet. A lower-frequency event is not automatically a better opportunity because it may have a larger displayed multiplier; the probability and full settlement must be analysed together. No number here guarantees a result in an individual round.
Frequently asked questions
How do I calculate the chance of a wheel label?
If the rules define equally likely stops, divide the number of segments carrying that label by the total number of segments. Keep the fraction and state the assumption before converting it to a rounded percentage.
Does 1 out of 54 mean the bonus will happen every 54 rounds?
No. It is a one-round probability under the stated model. It does not schedule the next occurrence or guarantee one event in each block of 54 rounds.
Does sector frequency tell me the RTP?
No. RTP needs the probability and gross return for every settlement, including bonus outcomes and modifiers. Counts alone are incomplete.
Are Crazy Time and Funky Time wheel probabilities the same?
Do not assume so. They are distinct products with their own rules and wheel structures. Verify each product’s current help and do not transfer a count table between them.
What if the source does not list all sector counts?
You can report the known count share if the denominator and assumptions are clear, but you cannot calculate the missing outcomes. Mark the probability distribution incomplete and avoid an overall RTP claim.
Can I use a recent-results chart to improve the probability estimate?
A history panel documents past events. It does not by itself change the next round’s rules or show that an outcome is due. A different conclusion would require evidence that the process is state-dependent.
Probability arithmetic is descriptive, not a way to control a game outcome. If you choose to gamble, decide a spending and time limit first; the site’s safer-gambling information explains ways to keep play within boundaries and where to seek support.
Sources and verification boundary
- Evolution, Crazy Time product page and How to Play, checked 7 October 2026: confirms the product, 54-segment main wheel and separate bonus stage; the current accessible page does not list all main-wheel label counts.
- Pennsylvania Code § 690.1, checked 7 October 2026: an official, jurisdiction-specific temporary Crazy Time layout rule with the historical segment counts above; it states that its provisions expired on 23 March 2026. It is not current New Zealand operator help.
- An Evolution game-rules PDF mirrored by an operator was found in search results, but a direct fetch was inaccessible during review. Its snippet was not used as sole verification for current settings.
- Competitor/analysis comparison checked 7 October 2026: Wizard of Odds and LiveCasinoData Crazy Time analyses. Used to identify common confusion between frequencies, bonus-stage calculations and RTP; no secondary probability claims are adopted as product rules.
- No search-volume, rankings or account-specific operator configuration was supplied. Segment counts do not verify a local offer or a complete RTP model.
For the Crazy Time specifics behind the worked example above, see the Top Slot, payouts and stated limits and strategy and myths.